New Native Google Analytics Dashboard
New Native Google Analytics Dashboard
What the redesigned dashboard builder in Google Analytics changes — and where it fits alongside your existing reporting.
Google is rolling out a redesigned, native dashboard builder inside the Reports section of GA4. It restores functionality many teams missed from Universal Analytics and sits between the rigid standard reports and the more complex Explorations. The rollout is gradual and reaches accounts over several weeks, so not every property will see it on the same date.
What's New
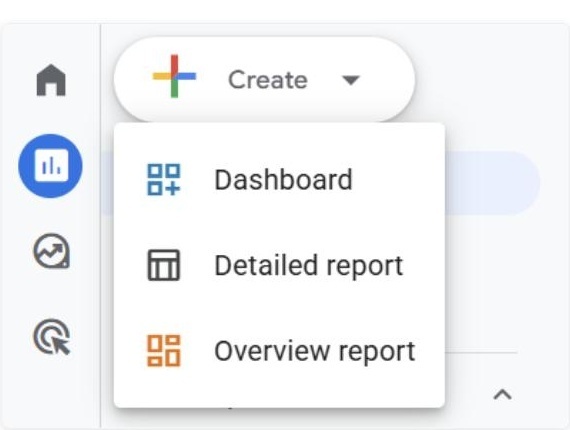
One-click creation: A single "+ Create" button replaces the old multi-step setup wizard. Any existing report can be turned into a dashboard in one click - Google's framing is "less digging, more doing".
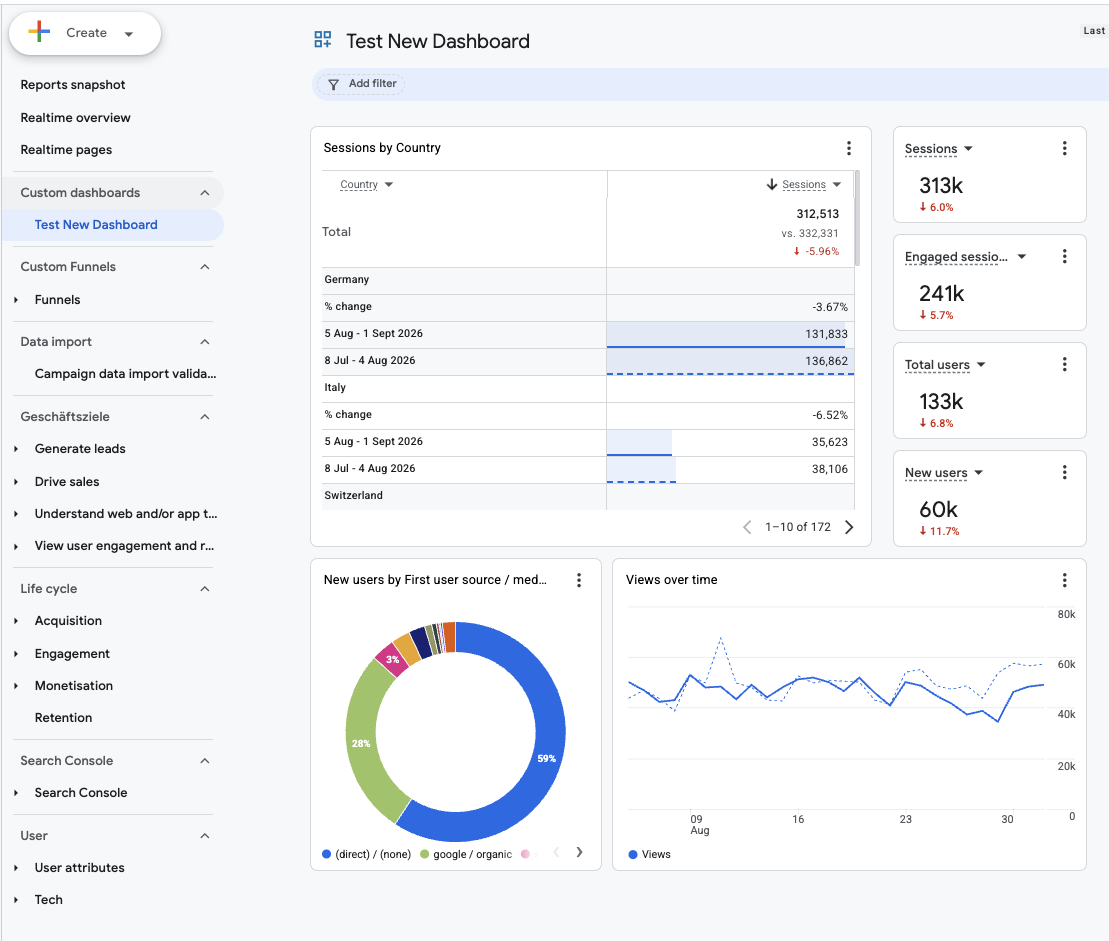
Editable canvas: Cards are dragged and resized directly on the canvas. Funnel visualizations can be placed straight onto a dashboard - previously only possible inside a separate Exploration.
Saved as a real view: New dashboards save automatically into the left-hand navigation, so they behave like a permanent saved view rather than a temporary report.
Extra data on hand: The raw "Exits" metric and the "Page Referrer" dimension are selectable here even though standard reports don't offer them. Google Ads metrics appear natively on linked properties.
What you can do with it
Build a lightweight overview without leaving GA4 or setting up a separate Looker Studio report - closing a gap that has existed since Universal Analytics was sunset.
No Data API quota concern: data comes directly from GA4 rather than through the Looker Studio connector - relevant for high-traffic properties.
Six visualization types: scorecards, line charts, bar charts, donut charts, funnels and data tables enough for KPI trends, channel mix and conversion funnels.
Dashboards can be saved, shared across teams and reused as templates.
Typical role-based set-ups: an executive view (revenue, conversion trend, marketing ROI), an SEO view, a paid-media view (spend, ROAS) and an ecommerce view.
Current limitations (as of 09/26)
Customisation: No calculated metrics, no custom styling or branding, no text annotations for stakeholder context.
Data scope: No blending across sources other than Google Ads, and no segment-level analysis.
Exports: Unreliable: PDF exports can clip content, Google Sheets export can fail, full-dashboard CSV exports are messy.
Known bug: Metric selection in funnel cards is currently faulty.
On the roadmap: Google has signalled Al-assisted report creation, but has given no date.
What We Recommend
Use GA4 dashboards for
Quick overviews and internal day-to-day monitoring where branding and cross- platform blending are not required. Worth adopting as soon as the feature reaches your property.
Keep Looker Studio for
Anything with your branding, multi-source blending (GA4+ ad platforms + CRM) or reliable scheduled exports. Those reporting deliverables stay where they are.
Related Articles
Related Articles
Campaign Data Import Validation For GA
Campaign Data Import Validation For GA

Frequency Management Across Screens: How to Run CTV Campaigns Without Ad Fatigue
Frequency Management Across Screens: How to Run CTV Campaigns Without Ad Fatigue
Is Safari Killing Your Google Ads Attribution? The Technical Protocol to Restore Lost GCLID Data
Is Safari Killing Your Google Ads Attribution? The Technical Protocol to Restore Lost GCLID Data